Companies are incorporating more video and interactivity in their online annual reports
Thanks to the internet, the annual report is scarcely recognizable. What was once a dull black-and-white printed book that made an almighty thud when it landed in your hallway is now a virtual journey through videos, charts, maps and all sorts of HTML graphics.
Video content is a central element of the annual report from US retailer Lowe’s: clips appear in all sections except for the financial information.
The opening CEO’s message to stakeholders is presented via an embedded YouTube video, lasting not much over a minute, illustrating the art of keeping things short and sweet.
‘Lowe’s focused the majority of its annual report resources this year on the online execution,’ notes Noah Butensky, chief operating officer at design company Curran & Connors. WPP, on the other hand, has only one video on its annual report site: an introduction from CEO Sir Martin Sorrell – but it’s the unique design that earns WPP a special mention.
Using work from late British artist Patrick Caulfield (an homage to the UK in the year of the London Olympics), the embedded video is stylishly bordered, giving it a noticeably 1960s television set appearance.
For added emphasis, the video is in black and white, with the icing on the cake Sorrell’s old-fashioned rectangular glasses.
In its third year of online annual reporting, UK-based automotive distributor Inchcape has designed an online reporting center to act as a hub and starting point for all visitors, a move favored by 14 percent of the FTSE 100, according to research from reporting firm Black Sun.
The main reporting center links to the year in review, the annual report, a selection of videos and the main company website.
Inchcape has four videos on offer on the main reporting center. These are all mainly promo videos, talking about the company and what it does. Some are quite long, but the strategy video links perfectly with the automotive theme, entitled ‘Our strategy in 0-90 seconds’.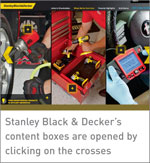 Stanley Black & Decker has been adapting its approach to videos for three years. The power tools firm first produced a year-in-review website in 2010, featuring a series of executive interviews.
Two years on, the videos cover the brand story and anchor the rest of the site. The clips are also being used widely within in the company for a variety of audiences.
Interactive tools
Video is only one way to grab attention in an online report, however. Companies are also including interactive tools to hook investors.
Stanley Black & Decker is one such example: most of its report pages have content boxes that open when clicked to display more detail on the company’s range of products, from biometric readers to high-tech welders. 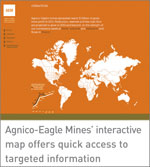 One of the more popular tools is the interactive map, highlighting important operational sites or store locations. Agnico-Eagle Mines puts this feature to good use in its annual report this year.
When users click on the ‘Operations’ section, they are presented with a striking orange and white map of the world, along with a list of Agnico’s mining assets.
‘Clicking various page-drivers, like a mine name or location, takes users directly to the relevant content,’ says Eric Johnson, director of strategic communications at The Works Design Communications.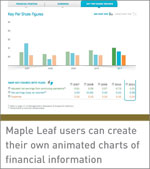 Some companies are even extending their interactive tools to the financials section.
Maple Leaf uses colorful animation and custom-search features to allow users to create their own charts, with variables such as which years and key figures to include. There’s also the option to swap between bar and linear chart views.
No more print
As companies increasingly focus on online reports, some – such as Pfizer – are doing away with print entirely. Pfizer’s printed product, which had been getting smaller and smaller, disappeared completely this year.
Instead, the firm brought out an ‘online-only integrated’ annual review, says Ideas on Purpose principal Michelle Marks.
The fully integrated nature of Pfizer’s offering means financial, social and environmental issues are all covered in the same place, a practice the company has followed since 2011.
QR adoptionQR codes are used in many companies’ printed annual reports in an attempt to link shareholders to the online version. These are essentially printed barcodes that can be read by a smartphone, opening up the online link. The printed report from Lowe’s, for example, uses a total of four QR codes, linking to the main report, as well as to individual sections. |
The review opens with a video outlining the company and its values. From then on, it does justice to the complexity of Pfizer’s business, offering huge amounts of information for the dedicated reader.
Southwest Airlines also brought out a very detailed online report this year. It had to: its printed report is just a six-panel summary plus the usual 10K filing.
To counter the lack of a full printed report, users can build their very own specialized annual report online, taking sections from the website to form a PDF tailored to their interests – a tactic being followed by many other companies as they look for ways to move beyond print.
Five tips for a successful online reportKaren Almeida, consulting director at corporate communications agency Addison, offers the following suggestions for making the most of your online annual report.1. Present content in different ways to different audiences through a hybrid online report, which uses HTML for the front section and delivers the back as PDF and Excel downloads. 2. Group content based on type and user. Current and forward-looking information is more relevant to the informed investor, whereas new investors will also be interested in contextual and explanatory information. 3. Do the work for the reader by structuring the content so that the key messages for each section are presented at the top of each page and links to more information are easy to find. 4. Ensure content is segmented into manageable chunks. 5. Make the most of your site: use analytics to help you identify how it is being used and what visitors are looking for, and then prioritize your investment accordingly. |