Trucost Sustainable Development Goal analytics

Sponsored content
Highlights
- Using the Trucost SDG Dataset, investors can calculate the proportion of a company’s Sustainable Development Goal (SDG) revenues that are positioned for achieving the UN’s 2030 Sustainable Agenda.
- Within the S&P 500 and MSCI World indices, equities with the highest SDG exposure (Tertile 1) outperform those with the lowest (Tertile 3) by 2.1 percent and 1.6 percent, respectively, on average annually.
- Constructing SDG-aligned portfolios from the S&P 500 and the MSCI World results in an increase in positive active return over the time period of +10.4 percentage points and +12.7 percentage points, respectively.
Sustainable development considerations
In 2015 the United Nations launched the 17 SDGs that were adopted by 193 countries. The SDGs outline a set of objectives to be achieved by 2030 that aim to end poverty, hunger and inequality, while tackling climate change, improving health and education and spurring economic growth.
In contrast to the earlier Millennium Development Goals, the SDGs emphasize not only the role of government and non-government sectors, but also the role of businesses to operate responsibly and pursue opportunities to solve societal challenges.
The market opportunity
Achieving the SDGs will require $5 tn to $7 tn in annual investment and the United Nations Conference on Trade and Development outlines how sustainable and responsible investments represent high-potential sources of capital for the SDGs1. According to the Business and Sustainable Development Commission, putting the SDGs at the heart of the world’s economic strategy could unlock $12 tn in opportunities and 380 mn jobs a year by 20302.
As of 2016, $8.2 tn was invested in this asset class3 and the bond market for sustainable business is growing. For example, in 2018 global green bonds reached $155.5 bn, up 78 percent on the previous year.
Trucost SDG Analytics
The Trucost SDG Analytics Dataset helps investors understand which companies are contributing toward the SDGs and how they are doing so through their current business models. It also provides information on how exposed a company may be to SDG-related risks or risks that may detract from achieving the goals. The data can be used by investors to analyze potential exposure to a variety of SDG-related risks, measure SDG-alignment, benchmark companies against each other in terms of their SDG performance, screen or optimize portfolios and report to stakeholders.
Trucost evaluates the positive impact companies may have on the SDGs via how they generate revenue. SDG-aligned revenues evaluate the share of revenue derived from products, services and technologies that contribute to SDGs. The share of SDG-aligned revenue is determined by mapping company revenue by product category to a database of SDG positive-impact products and services, called the Trucost Positive Impact Taxonomy.
This database was developed by Trucost based on a bottom-up analysis of the 169 SDG targets to identify categories of products, services and technologies that directly contribute to the achievement of each target. Products and services may be relevant to multiple SDG targets due to the inter-relationships inherent in the SDGs.
Creating an SDG revenue factor
Using the Trucost SDG Revenue Share Dataset, investors can now calculate the proportion of company revenues that are aligned to the 17 SDGs. We aggregated the percentage of revenue for each company from the 17 SDGs and arrived at a total percentage of a company’s revenue that is aligned to all SDGs. For example, Johnson & Johnson (JNJ) has 100 percent of its revenue stream in total from the 17 SDGs4.
This total SDG revenue factor can now serve multiple purposes, including:
- Identifying companies that are positioned for achieving the UN’s 2030 Sustainable Agenda
- Back-testing the SDG revenue percentage as a factor.
SDG revenue back-test
Is there any outperformance/underperformance within equities that exhibit higher/lower percentages of SDG revenue?
We ran a back-test on the S&P 500 and the MSCI World indices using the following criteria:
- Independent/dependent variable: Total SDG revenue percentage/forward returns
- SDG revenue percentage bucketed into three tertiles (highest SDG revenue percentage in Tertile 1)
- Tertiles are country and sector-neutral
- End-of-month rebalancing
- One-month-forward equally weighted tertile return.
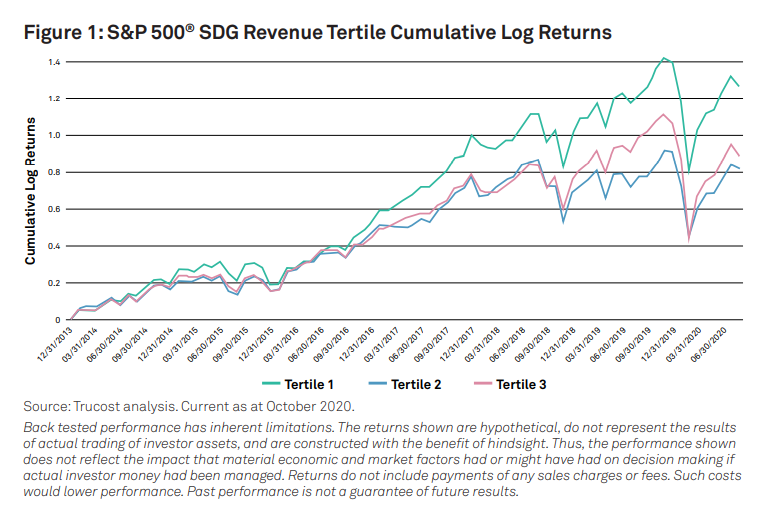
S&P 500
Tertile 1 (contains the companies that have the highest exposure to SDG revenue) outperforms Tertile 3 on average by 19 basis points (bps)/month, or an average top/bottom spread of 2.1 percent annually5. Interestingly, Tertile 3 outperforms Tertile 2 in 2018 until the Covid-19 sell-off in 2020; this would require further analysis to ascertain why.
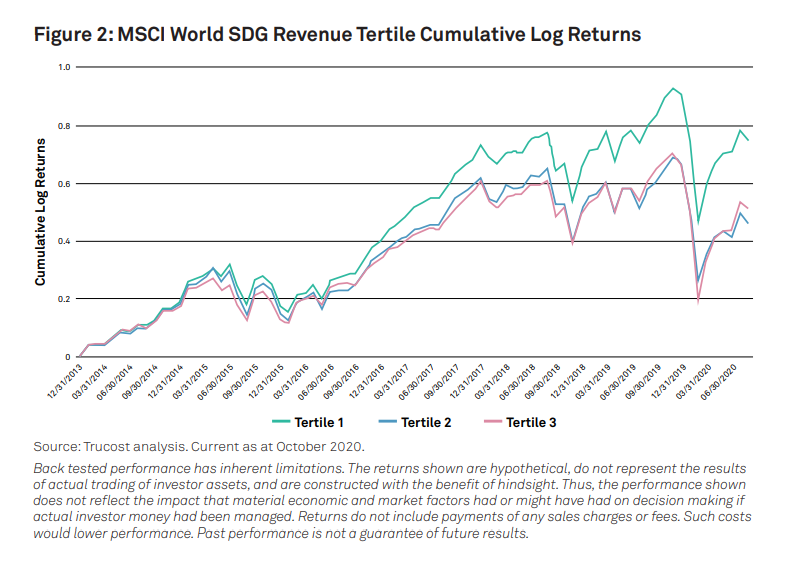
MSCI World
Tertile 1 (which contains the companies that have the highest exposure to SDG revenue) consistently outperforms Tertile 3 on average by 14 bps/month, or an average top/bottom spread of 1.6 percent annually6.
Aligning portfolios with the SDGs
After analyzing the SDG revenue dataset within the S&P 500 and the MSCI World, we can see that the top tertile outperforms.
Using these results, how would a portfolio constructed from top-tertile equities perform versus its underlying benchmark?
We constructed portfolios based on the S&P 500 and the MSCI World indices using the following parameters:
- Top tertile of equities from SDG revenue rebalanced monthly
- Country and sector-neutral
- Equally weighted positions within sector/country exposures.
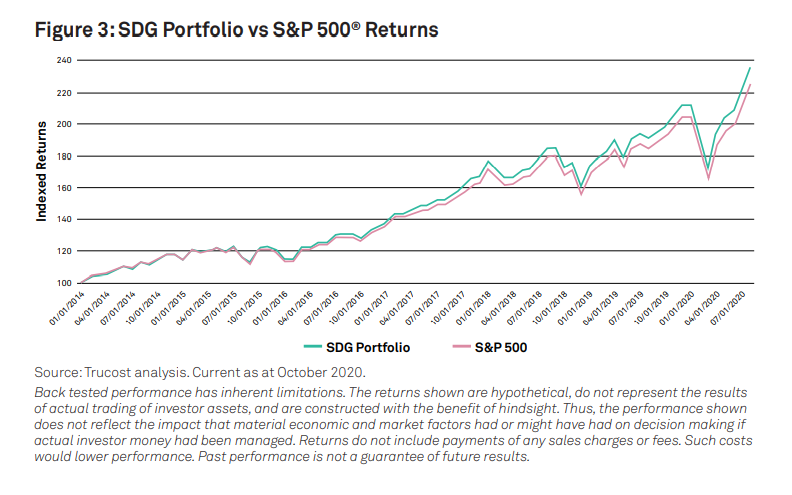
SDG portfolio – S&P 500
From January 2014 to August 2020 the S&P 500 went up 125.8 percent. In the same period the SDG portfolio went up 136.2 percent, a difference of +10.4 percentage points over the course of the analysis. The realized tracking error of the portfolio is just 0.58 percent with a Sharpe ratio of 0.7 versus 0.645 for the S&P 500.
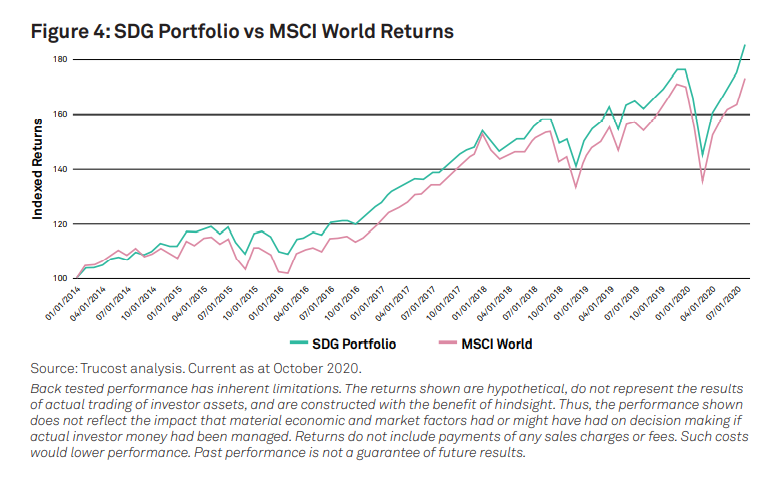
SDG portfolio – MSCI World
From January 2014 to August 2020 the MSCI World went up 73.3 percent. In the same period the SDG portfolio went up 86 percent, a difference of +12.7 percentage points over the course of the analysis. The tracking error of the portfolio is just 1.09 percent with a Sharpe ratio of 0.58 versus 0.56 for the MSCI World.
Summary
Investors can calculate the proportion of a company’s SDG revenues that are positioned for achieving the UN’s 2030 Sustainable Agenda. In doing so, companies can be aligned with these goals while also being able to identify their outperformance/underperformance versus their high/low exposures to SDG revenue.
Portfolios can be aligned to SDG top-tertile companies while maintaining their underlying benchmark characteristics. The SDGs have garnered widespread backing for their effective harmonization of the three dimensions of sustainable development: social inclusion, environmental protection and economic growth. This analysis provides additional insight on companies that are pursuing sustainable development through their business models as well as historical performance.
References
1 United Nations Development Programme 2020
https://www.undp.org/content/oslo-governance-centre/en/home/sustainable-development-goals/goal-17-partnerships-for-the-goals.html
2 Release from the Business and Sustainable Development Commission, January 16, 2017
http://businesscommission.org/news/release-sustainable-business-can-unlock-at-least-us-12-trillion-in-new-market-value-and-repair-economic-system
3 United Nations Development Programme 2020
https://www.undp.org/content/oslo-governance-centre/en/home/sustainable-development-goals/goal-17-partnerships-for-the-goals.html
4 Under Trucost’s Positive Impact Taxonomy, this refers to medical devices and pharmaceuticals that align with all SDG 3 targets, and personal hygiene projects that align with SDG 3 Target 3.9.2 and SDG 6 Target 6.2
5 T-Stat 1.404 (>10 percent confidence level), monthly top-bottom spread: 0.19 percent
6 T-Stat 1.349 (>10 percent confidence level), monthly top-bottom spread: 0.14 percent
For more information, please visit www.spglobal.com/marketintelligence/en/campaigns/see-what-matters
Authors
Liam Hynes, EMEA head of capital markets product specialists, S&P Global Market Intelligence
Rochelle March, manager of ESG innovation and analytics, Trucost (part of S&P Global)