IR teams and budgets have shrunk since 2011, finds IR Magazine research
How much has the investor relations role changed since 2011? We have tried to answer this question as part of this year’s Global Investor Relations Practice Report, which examines exactly how IROs around the world practice their profession.
Included in the 2015 edition is a section that examines some of the headline figures – team size, budget, number of investor meetings and the like – from the past five years of IR Magazine’s research, which makes for interesting reading.
For one, 2015’s average IR budget of $491,000 is some way below the $561,000 recorded five years ago, despite the global average budget shooting up by $50,000 between 2014 and 2015. In fact, other than this recent turnaround, the amount of money IR teams have to spend has been steadily decreasing year on year since 2011.
This is reflected across the three regions investigated in the report (North America, Europe and South East Asia), where budgets steadily decreased between 2011 and 2014 before recovering this year. 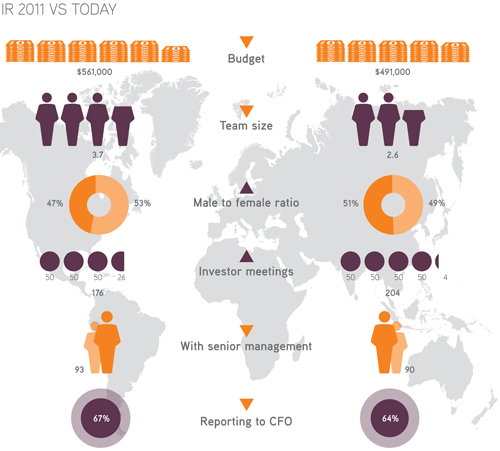
Though European budgets are the highest in the world in 2015, standing at $526,000, this is the first year this has been the case: from 2011 to 2014, North American budgets were on top. Meanwhile, Asian IR teams have been given just over half the budget of their North American and European counterparts since 2011.
Along with smaller budgets, IR teams have also slimmed down over the past five years, starting from an average of 3.7 people in 2011 and reaching 2.6 IROs in 2015. This downturn has evened out in recent years, with the average team shedding only 0.1 IROs between 2013 and 2015.
Even with reduced manpower, however, the average IR team has been more active on many levels, particularly when it comes to one-on-one investor meetings. Despite a small blip in 2012’s figures, teams have held increasing numbers of meetings each year, from 176 in 2011 to this year’s tally of 214, an increase of 38. The biggest year-on-year increase can be seen between 2012 and 2013, when an average 26 meetings were added to IR schedules.
This increased effort is even clearer when we look at the proportion of these meetings attended by senior management: this has dropped since 2011, when more than half (53 percent) of meetings had a member of the C-suite in attendance, to 44 percent this year. In real terms, this means senior management teams attended an average of 93 meetings in 2011 but only 90 this year.
So IR teams seem to have fewer resources, less manpower and more meetings to manage on their own than they have done in the past. How else does the 2015 IR landscape differ from that seen in 2011? For a full look at these five-year trends, and deeper information about wider investor relations practice this year, check out the Global Investor Relations Practice Report 2015, available here.

