IR professionals are split on the value of technical analysis to their jobs, finds Adam Piore
Technical analysis seems to have little to do with the primary mandate of most IR roles – jobs that require telling the story of company fundamentals, not speculating about chart patterns that have nothing to do with the long-term plans of management.
No surprise, then, that many IROs dismiss it as hocus-pocus and argue it is of little use to them.
Some IROs still say they find technical analysis a useful tool, however, for reasons ranging from the insight it can provide into external factors buffeting stock prices to the ease with which it can get a conversation going – such as discussing last night’s football game, or the weather.  ‘In the long run the technicals shouldn’t matter,’ says Paul Surdez, vice president of IR at Covance.
‘But we know they do, because that’s what everyone talks about on a day-to-day basis, including traders and even some of our shareholders, so it’s really important to understand the psychology of it all.’
Whether any of these techniques are an accurate gauge of mass psychology or simply a self-fulfilling prophecy is a matter of dispute.
‘We don’t do hocus-pocus, we don’t do voodoo,’ says Jeanette Young, a former pit trader, technical analysis guru and author of The options doctor.
‘The marketplace tells us where those numbers are, we don’t tell it. We’re observers of actions and from our observations we are able to deduce what might happen in the market.
‘It’s pure information or pure price, it has nothing to do with how many widgets you have in the warehouse. Nobody cares about earnings. We’re saying if there is important information, it is reflected in the price.’
But technical analysis is by no means a sure thing, counters Stephen Minihan, founder of Financial West Group and a professor at UCLA. ‘Everybody is doing all this technical trading,’ he says.
‘Maybe they could be out sacrificing small animals and getting as much insight; I don’t think you could really call it reliable. But you could say a big part of the market is using this thing to think about a stock, and that’s really interesting to know.’
Growing sophistication
The technical traders’ impact, adds Minihan, has become more pronounced recently, as a growing number of high-frequency traders use sophisticated computer programs that attempt to ‘anticipate moves on top of those occurring. That creates momentum, which is driving a lot of people who aren’t technical traders crazy.’
All of that, argues John Wilcox, chairman of Sodali, makes it useful for IROs to pay attention. ‘I don’t think it has any real benefits and I don’t know how to control it,’ he says. ‘But what you should do is try to be aware of it, so that if stock price is affected you can at least explain it to shareholders.
'It’s a little bit like the problem of short selling, which is often done for technical reasons but can have an effect on stock prices. Just being aware of it can be good for easing anxiety within the company.
‘People get worked up, directors get worried, CEOs get worried, and that can put a lot of pressure on the IRO, who is viewed as a key link to stock markets and a lot of the time gets the blame when a stock is not moving in accordance with the market.’
Rob Hall, head of IR for Manitoba Telecom Services, says he also often looks at the technicals for the macroeconomic picture, to get ‘insights into headwinds’ that might affect his company’s stock.
He uses the information internally to communicate with company executives, and externally to communicate with investors looking for information.
He finds conducting cross-market analysis in currency, gold, fixed income and equities markets useful, and then homing in on the telecoms sector, looking at support and resistance levels and momentum levels.
‘If the stock doesn’t respond the way one would expect to good news or bad, it can provide some insights into the reason why,’ Hall says.
Surdez has a different use for technical analysis. ‘I use it to build relationships,’ he says. ‘It’s an extra line of conversation with investors, management teams, traders and specialists when I visit the exchange. It is kind of like talking about a football game: Hey, what do the technicals look like today?’
Aware of the numbers
Several leading IROs are skeptical of the potential value, however. Kevin Stitt, director of IR for Bank of America Merrill Lynch, notes that technical analysts are ‘clearly one group of investors, but we never spend time with them.
'My job is to make sure investors have whatever they need to make a decision, so I spend my time talking to people who are actually using the information I provide to make financial decisions.
'I can’t do much about the information technical analysts are looking at. But certain people move on it, so you have to be aware of it.’
Stitt says some analysts in the company monitor the technicals and bring technical moves to his attention when the stock exceeds certain thresholds. ‘I have limited knowledge’ he says.
‘But there are people here who watch it. They might tell me, Your moving average is breaking through a low or high, and people are going to act on that.’
Stitt notes, however, that such explanations are of limited use when he is dealing with a harried investor concerned about a stock move.
‘If I get a call from a long-time investor, providing an explanation about technical things isn’t a sufficient answer,’ he explains. ‘A sufficient answer is, Europe is blowing up. So I just don’t spend a lot of time looking at it.’
David Myers, vice president of IR for Express Scripts, says technical analysis is based on what a company has done in the past. His job, he contends, is to talk about the future.
For example, Express Scripts announced a $29 bn acquisition of Medco Health Solutions over the summer, and has been engaged in a public dispute with Walgreens, both of which will have a far greater impact on the company’s value – and thus its stock price – than technical trends, Myers argues.
‘I’m focused on communicating the attributes of our company and our competitive differentiation, and less worried about focusing on technical analysis,’ he says.
‘We never stand still, we have made a number of acquisitions and we reinvent ourselves, and what happened in the past isn’t as relevant to what happens in future.
What the future holds is more than what shows on a piece of paper, and my IR role is to help investors understand who we are, why we are different and how we will position ourselves for the future.’
Event horizon
Minihan says a far more useful mathematical tool for an IRO is the use of ‘event analysis’. This technique uses an equation that expresses how a stock usually moves in relation to the rest of the market, and can help IROs identify anomalies in that correlation.
If a company has made an announcement or news has broken about its prospects, an IRO can perform an event analysis to determine what impact that has had on stock price.
‘Let’s say you’ve just announced a new product to the market,’ says Minihan. ‘If [your stock] doesn’t move much in relation to the market, you could say the market doesn’t think much of it. If it does move, that information is useful, too.
‘It’s not what everybody thinks of technical analysis most of the time. But an IR person can ask: how have we managed the company and how have decisions made by the company been reflected in the stock market? Does the market think it’s a good or a bad decision? Those are useful questions.’
Die-hard technical analysts, however, insist their craft is more useful than it has ever been – and it’s only getting more so. ‘We’re in our heyday,’ says Young. ‘Give me a ruler and a pencil and I will tell you where we are going.
‘Earnings and all other things the fundamentalists argue are important get thrown out the window when you have a flash crash, when you see Procter & Gamble being sold for two cents.
'A technical analysis, when you get into trouble, will tell you ‘get out now, because you broke a level’. We are able to look at it coldly without emotional attachments.’
Tools of the tradeTechnical analysts believe that by charting historical pricing information and scrutinizing it for patterns, you can predict where the stock is headed. In its most basic form, the practice involves plotting the prices and then drawing a line connecting the lowest prices, a line connecting the highest prices, and carrying both those lines forward into the future.The space in between those two lines constitutes the ‘channel’ within which the stock trades under normal circumstances (for details, see Support and resistance levels, below). When the stock approaches the outer edges of those channels, it is likely to bounce: at the upper levels of the channel, investors are likely to consider the stock too expensive – technical analysts call this upper line ‘resistance’ – while at the lower levels, the stock starts to look cheap – technical analysts call this lower line ‘support’. In addition to charting, technical analysts have a wide array of more complicated mathematical tools to tell them when to buy and sell, of which Bollinger Bands are among the best known. Developed by John Bollinger in the 1980s, this tool calculates the average movement of a stock, examines the distribution of the prices, and then reveals when the price falls out of a range that is statistically significant – which is generally when a stock spikes or drops two standard deviations above or below the moving average. Unlike support and resistance, which tell you when a stock is likely to bounce, Bollinger bands tell you when a stock has broken out of its normal range, which indicates that some factor has infused the stock with momentum that is likely to continue to carry it further up or down. Thus a sell signal might occur when a stock falls two standard deviations below its normal range, which would mean the move has exceeded about 95 percent of the probable prices in a distribution (this makes it extremely likely some significant event has been added to the mix that will continue to give it momentum). A buy signal would occur when the stock moves two standard deviations above the normal range. Technical data analysts also have various archetypal chart patterns in their toolbox that are statistically associated with a significant rise or fall in a stock. Among them are the ‘head and shoulders’ pattern, where the stock spikes and falls three times, or a ‘double bottom’ where two valleys followed by a rise might presage a significant climb. 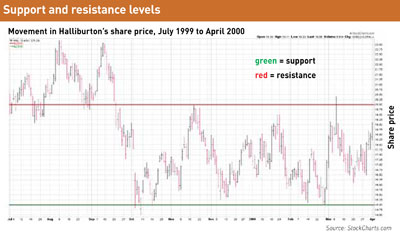 |